- ARPDAUPosted 14 years ago
- What’s an impressive conversion rate? And other stats updatesPosted 14 years ago
- Your quick guide to metricsPosted 14 years ago
A comprehensive list of metrics for free-to-play games

This is a guest post from Shyamal Dave of Mech Mocha, an independent free-to-play studio based in Ahmedabad, India.
A decent number of downloads is a good head-start and a very good reason to throw a boat-party for your team. But, as a game developer or an investor in a gaming company you need to see through the analytics and understand a lot beyond downloads. Here’s a comprehensive list of metrics used by game businesses to gauge the success of their games, and should help you gauge yours.
Player Acquisition Metrics
Currently the acquisition costs of a new player range from $0.5 to $2.5. This depends a lot on the networks chosen to acquire the players and the genre of the game, but looking at the market dynamics we can clearly see that it is on the rise. This is a direct result of the fact that large publishers are actively employing widespread ad networks to promote their games, driving up the overall costs. This might have a slight effect on the budgets of established game studios, but more worryingly, it sounds very ominous for indie game developers.
Paid vs. Organic
How have you acquired your players? Organic players come to your game because they somehow saw it in the app store, because their friend told them to check it out, or probably while they accidentally saw their boss at it when they expected to see his head pouring over an Excel sheet.
The paid players do not come via any of the aforesaid ways. You ‘buy’ them. Directly or indirectly you have paid for the beautiful action that they did with their finger: click on the download button of your game.
This is the simplest way of segregating your players and often one of the most important metrics for any kind of game.
No. of installs by country
Not all games are a Candy Crush Saga, to be played by individuals across nations, or a Flappy Bird to be equally despised (and yet played). There are certain games that target a particular geographic audience; for example, the games made for the Japanese, Chinese and Korean audience. Has your game worked in the region you expected it to? Or has some other region shown considerable interest in your game? These are some of the relevant questions that can be addressed by interpreting the number of installs per country.
No. of installs by build
Did you release a St. Patrick Day version that wasn’t able to enhance the player’s experience and has led to sudden uninstalls of your game? Has the newest upgrade that you just gave out caused much angst amongst the players? Or a sudden spike in downloads after a major overhaul? Positive or negative, the number of installs by build is surely going to deliver an important message to you, and is thus, an important metric to keep a track of.
k-factor
The k-factor is the measure of viral growth.
A k-factor of 1 means you’re gaining one player through one existing player, and your game is neither growing nor declining. A k-factor of less than 1 means that your game requires marketing efforts, else it might run out of players. While a k-factor greater than 1 means that your game is growing exponentially. Most of the games usually have a k-factor that is <1, as most of the games do not grow exponentially.
In terms of virality, the k-factor measures the ‘infections’ caused by one infected player. For example, if your k-factor is 0.5, then each “infected player” will infect 0.5 other players (and cause them to download/play your game). This however is not a true measure of virality because there are many more factors, usually uncertain and unpredictable, that lead to the virality.
CPA and eCPA
CPA is the Cost Per Acquisition. Let’s say you have spent $5000 on Chartboost and you get 2500 new players your CPA would be $5000/2500 = $2/player.
Now, there are several elements that come into play to affect the overall cost of acquisition for mobile games. Mostly it is affected by parameters such as geographic region, platform, genre, and download size. Depending on whether the game is F2P or paid and the quality of player that it is being delivered to, the cost of acquisition keeps on varying. You might have to churn out $0.5 to $2.5 net per install in order to gain quality players and/or a good number of them. Usually this is what a basic plan that you start with looks like. The bids increase as you pump up the volumes.
The services of ad networks like InMobi or AdMob might cost you a bit more, usually in the range of $5 to $10 per install. These networks generally employed by major game studios and might not be economical for indie game developers. Many developers prefer Chartboost as it gives access to a quality set of players at a decent cost.
The eCPA is the effective Cost Per Acquisition and is the cost of acquiring a player and all the others that result in downloading your game because of this person. In a way, it can be called the measure of the potential of the virality of your network. The eCPA is always less than the CPA because of the additional effect it causes down the line. The biggest and the only catch being, it is very hard to measure. For example, how do you keep a check that it was your particular acquisition spend that caused the ripple effect?
But for simplicity, developers take into account the total number of installs of the game in a time-frame and the total amount invested. Let’s say total amount invested is $2000 for buying 1000 installs. The total number of installs that month was 5000. The CPA is 2000/1000 = 2 [edit: an earlier version of this article incorrectly had this as 0.5. Apologies.] & eCPA is 2000/5000 = 0.4
Usage & Retention Metrics
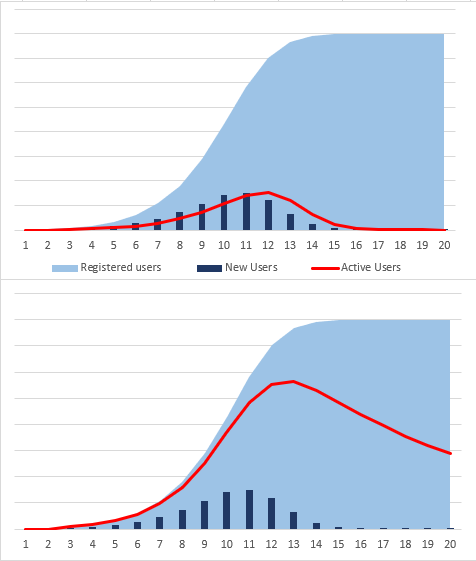
Retention is defined as a calculation of active players over time.
If say, you successfully acquire 4000 players with the help of a marketing campaign. The retention of your game is 50% on day 5 if 2000 of those players are active on that day. If on the next day, there’s a drop of 10% of the remaining players, then the retention on day 6 is 45%, and so on. Usually the day 1, 7 and 30-days retention rates are measured, and rates of 40%, 20%, and 10% are considered a good benchmark. These benchmarks change drastically according to the genre of the game (strategy games have a high 30-day retention compared to casual games).
Day x retention
This is the frequency of the players returning to play your game after installation. It is often expressed as a percentage and is used to track the performance of features or builds of your game. A high retention indicates that people are really liking it (technically, high engagement) and hence high chance of monetization.
Figure out the set of players who have played in the past 4/7/15 days, then over weeks, and then over months. It is necessary to understand the set of truly ‘active’ players. Once you have these numbers, you can start measuring the survival and churn rates, as a percentage of those who were active a point in the past. You have the liberty of choosing the point of reference, but make sure you choose a proper point, or else this will distort your figures. Playing round the numbers can reveal different types of data; like segregating demographically, or temporal segregation, for example, number of hours played, number of times played.
DAU, MAU, DAU/MAU
The metrics defined to measure the active users are DAU: Daily Active Users and MAU: Monthly Active Users. These are respectively the number of players on a given day and in a given month. These numbers can help you manage the server loads and other such issues. The DAU is considered to be a more accurate measure of active users, whereas the MAU is usually used for long term planning.
The ratio DAU/MAU is used to measure stickiness of your players. How well the game is capable of retaining the players is indicated by this metric. In a way it exhibits the potential of the game to drive engagement and make it extremely compelling for the players, but it’s no indicator of the sales or IAP figures.
Session length
How long do players remain ‘in’ your game? This is answered by the session length. Let’s say you are seeing considerably longer sessions, that means the players are remaining engaged with your game. Some reasons could be high level of interest (your game’s really good, unputdownable), or of a medium to high level of difficulty and is consuming the players’ time. Albeit, if you’re observing shorter sessions, it can be engagement at only certain times; active session while the player is traveling or working, with sessions coming to an abrupt end when someone peeps onto the player’s desk. It becomes necessary for you to tweak your ad schedules and design in order to match with the player’s session length.
Churn rate
The churn rate is the percentage of players who will stop playing a given game in a month. Players often get bored and move onto other games or apps. The rate at which they do so is defined as the churn rate.
Churn rate = 1 – retention rate
Progression through the game
Do players play for some time before making a purchase? What is the stage that they make a purchase on? Is there are any specific point in the game where multiple users have been known to make purchases? These are some of the insights that might come up with this type of qualitative study of player behavior.
Monetization metrics
ARPDAU, ARPPU
The Average Revenue per Daily Active User (ARPDAU) and Average Revenue per Paying User (ARPPU) are two key monetization metrics that need to be measured.
Measured each month, the ARPDAU is basically the total revenue of the game on a day divided by the unique users that logged into the game that specific day.
ARPU is the Average Revenue per (active) User. For a casual game it can be in the range $0.10 to $0.20. It is driven by market size, growth rate, funnel conversion, subscription price, micro-payment conversion, etc.
The LTV (Life Time Value) is the average amount of money spent by each player. It includes the paying and non-paying players.
LTV = ARPU x (Avg no. of months a player plays your game)
= 0.15 x 6 (ARPU for a casual game considered here)
= $0.9
Conversion rate
The conversion rate is defined as the number of players who make an in-game purchase for the first time on a given day (editorial note: not all reported conversion rates represent a daily figure.). It is usually expressed in percentage and is used to assess the effectiveness of new upgrades or offers. Most of the conversion rate optimization techniques rely on the tweaking the UI and making the IAP experience more native for the player.
One classic example of an iOS game with an extremely high conversion rate is Natural Motion Games’s CSR Racing. Torsten Reil, CEO, Natural Motion Games had hinted about the inexplicably high conversion rates of the game. It was because of such strong rates that, in 2012, it was reported earning more than $12 million a month on iOS, translating to IAP of about $400,000/day. As per Reil’s verdict, this has been a completely organic growth.
In general, for casual games, the conversion rate is expected to be about 2-5%.
No of paying users, no of transactions
With each game developer making an attempt to bring in innovation to the platform the cost of development has considerably risen. This is why you need to track the number of paying users. A considerable number of these are your loyalists — it’s even more important to track their behavior and number. If you’re seeing a reduction, it’s important to track the reason ASAP.
In the same way, it is also necessary to track the number of transactions. This is a clear indicator of the upgrade/powerup that is being sold more than others, the repeat purchases of one thing by multiple users. Also, by tracking at even more detail you can see a particular user making similar or varied transactions, and make changes if required.
All in all, I hope this serves as a comprehensive list of the metrics being employed by game developers in order to study the game performance. Keep in mind that only specific metrics can be applied to your particular games. Choose the correct ones.
Related Posts


Related Articles:
-
 Subway Surfers has more monthly players than League of Legends, and other new stats
Deputy Editor Zoya Street has added another round of...
- Posted 12 years ago
-
Is conversion rate usually quoted daily, monthly or lifetime?
I got an email last week asking me the...
- Posted 12 years ago
-
Zynga’s conversion rate
I was digging into definitions of conversion rate, and...
- Posted 12 years ago


